
Making a statement
Hologram is a cellular IoT company where I worked as Director of Product Design. Customers can deploy connected hardware devices across 470+ carriers in 200+ countries—all on a single SIM. As one can imagine, billing customers based on a platform fee and global data usage can get complex.
Everything that happens in our platform comes back to what and how we charge our customers, so we found ourselves asking: “How can we improve the billing experience for customers of any size?”
Psst. I know what you're here for. Jump ahead to the final designs.
Outcome
The first iteration of this billing experience brought downloadable statements to the Hologram Dashboard. Before this, customers were emailed a hand-crafted invoice each month by someone in the Revenue team.
Now all Hologram users have access to a breakdown of their monthly statements, saving our team valuable time and making the data that much more at reach for users who would otherwise be using the API or doing complex spreadsheet merging wizardly in Excel.

User research
To help align our early research, we wanted to get a strong understanding of the journey a customer takes when receiving and paying for an invoice from Hologram.
- Understand what billing questions customers are trying to answer
- Identify who receives and pays the invoice each month
- Learn how Hologram can make it easy for customers to pay their invoice on time, every time
I worked with Hologram's Account Executives to identify users who tend to be responsible for billing in their organizations. Over the course of 2 months, we talked with 11 customers in total.

Starting scrappy
Before even getting into the interface, I wanted to see how users would interpret the raw billing data straight from our database. If this was all they had, how easily could they arrive at the answers they needed?
Using this spreadsheet, we asked them to perform common operations like calculating…
- The total monthly spend for data usage
- The total charges for a specific device
- The number of SIM renewals that took place
✨ Product opportunity
Our research revealed a few truths when it comes to billing.
- Most users are asking the same questions about their deployments: Questions like "Which data plan is working best for me?", "What SIMs are not using data and can I deactivate those?", "How much do we charge our customers?"
- Transactional reporting is unclear: That math test we had users complete using the spreadsheet? They almost all failed. The way billing information was stored in the database didn't match our users' mental model, resulting in incorrect cost calculations, projections, and device counts.
- Data is inaccessible to the roles most responsible for billing: Technical roles are often tapped to playact as a Finance persona because they are comfortable working in Hologram's Dashboard and APIs and are capable of turning raw billing data into something useful.
We need to build an experience that allows anyone get the answers they need to confidently pay their bill on time and from the Dashboard.
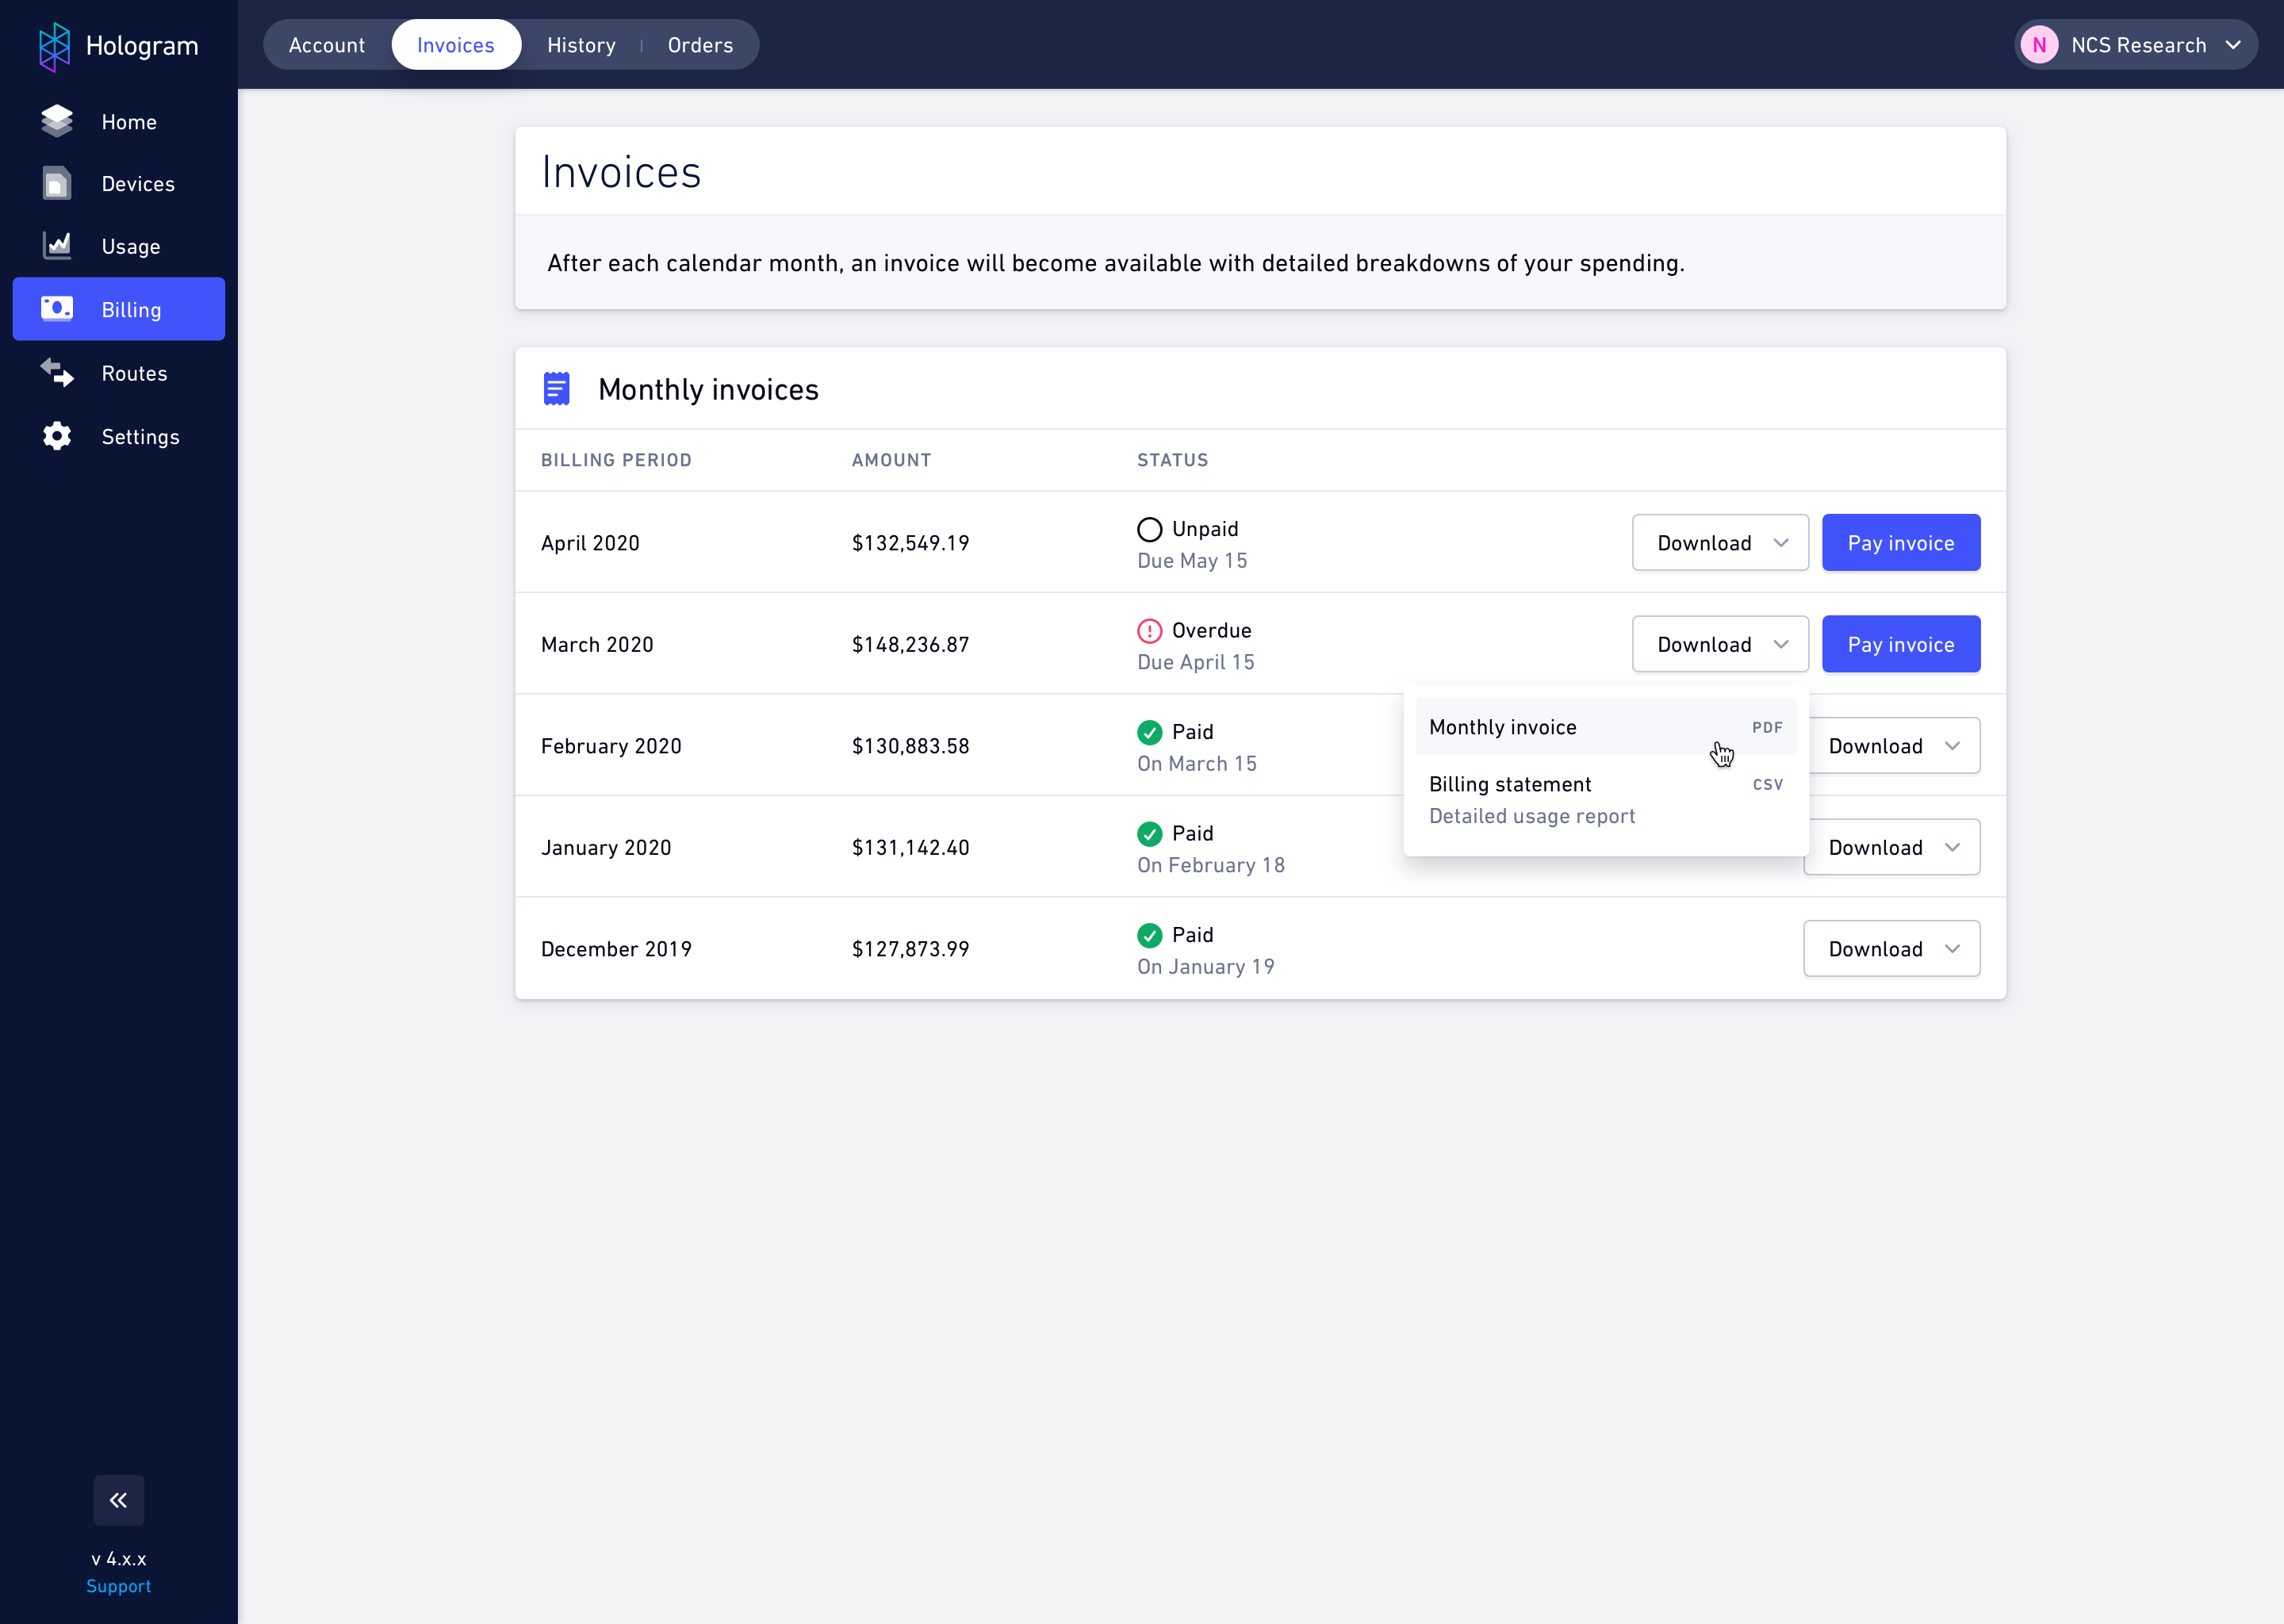
-
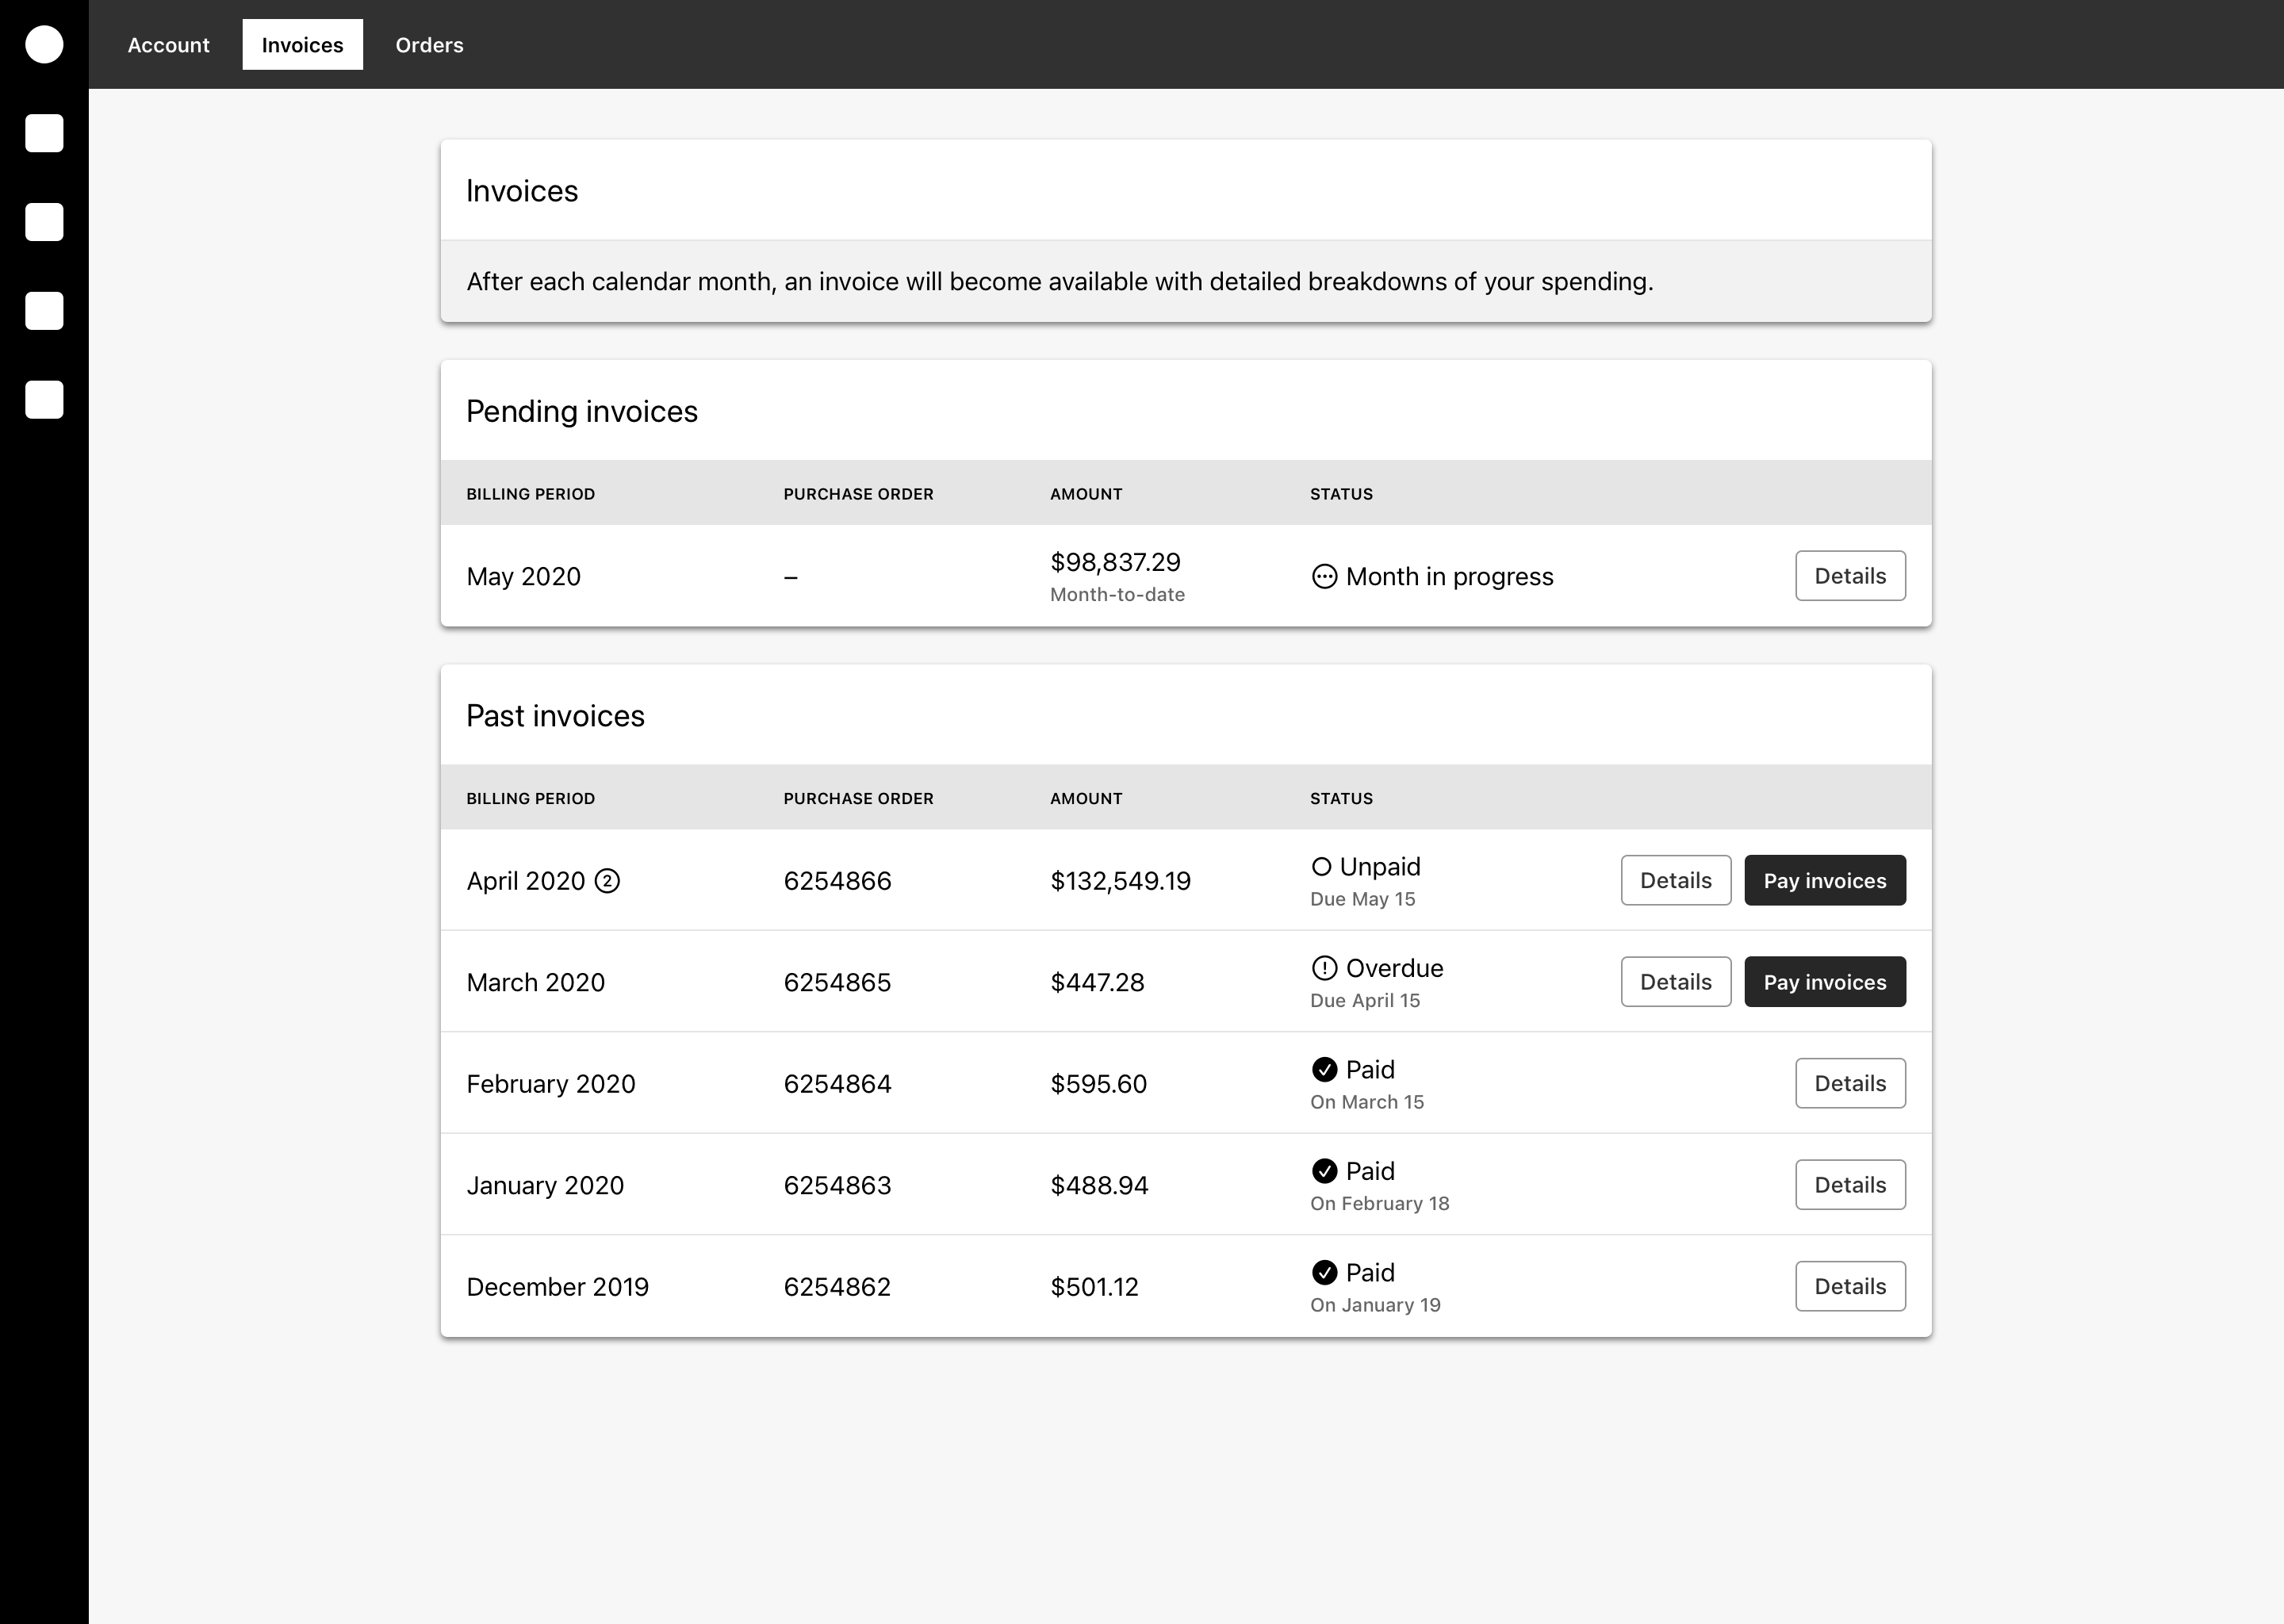
All invoices
-
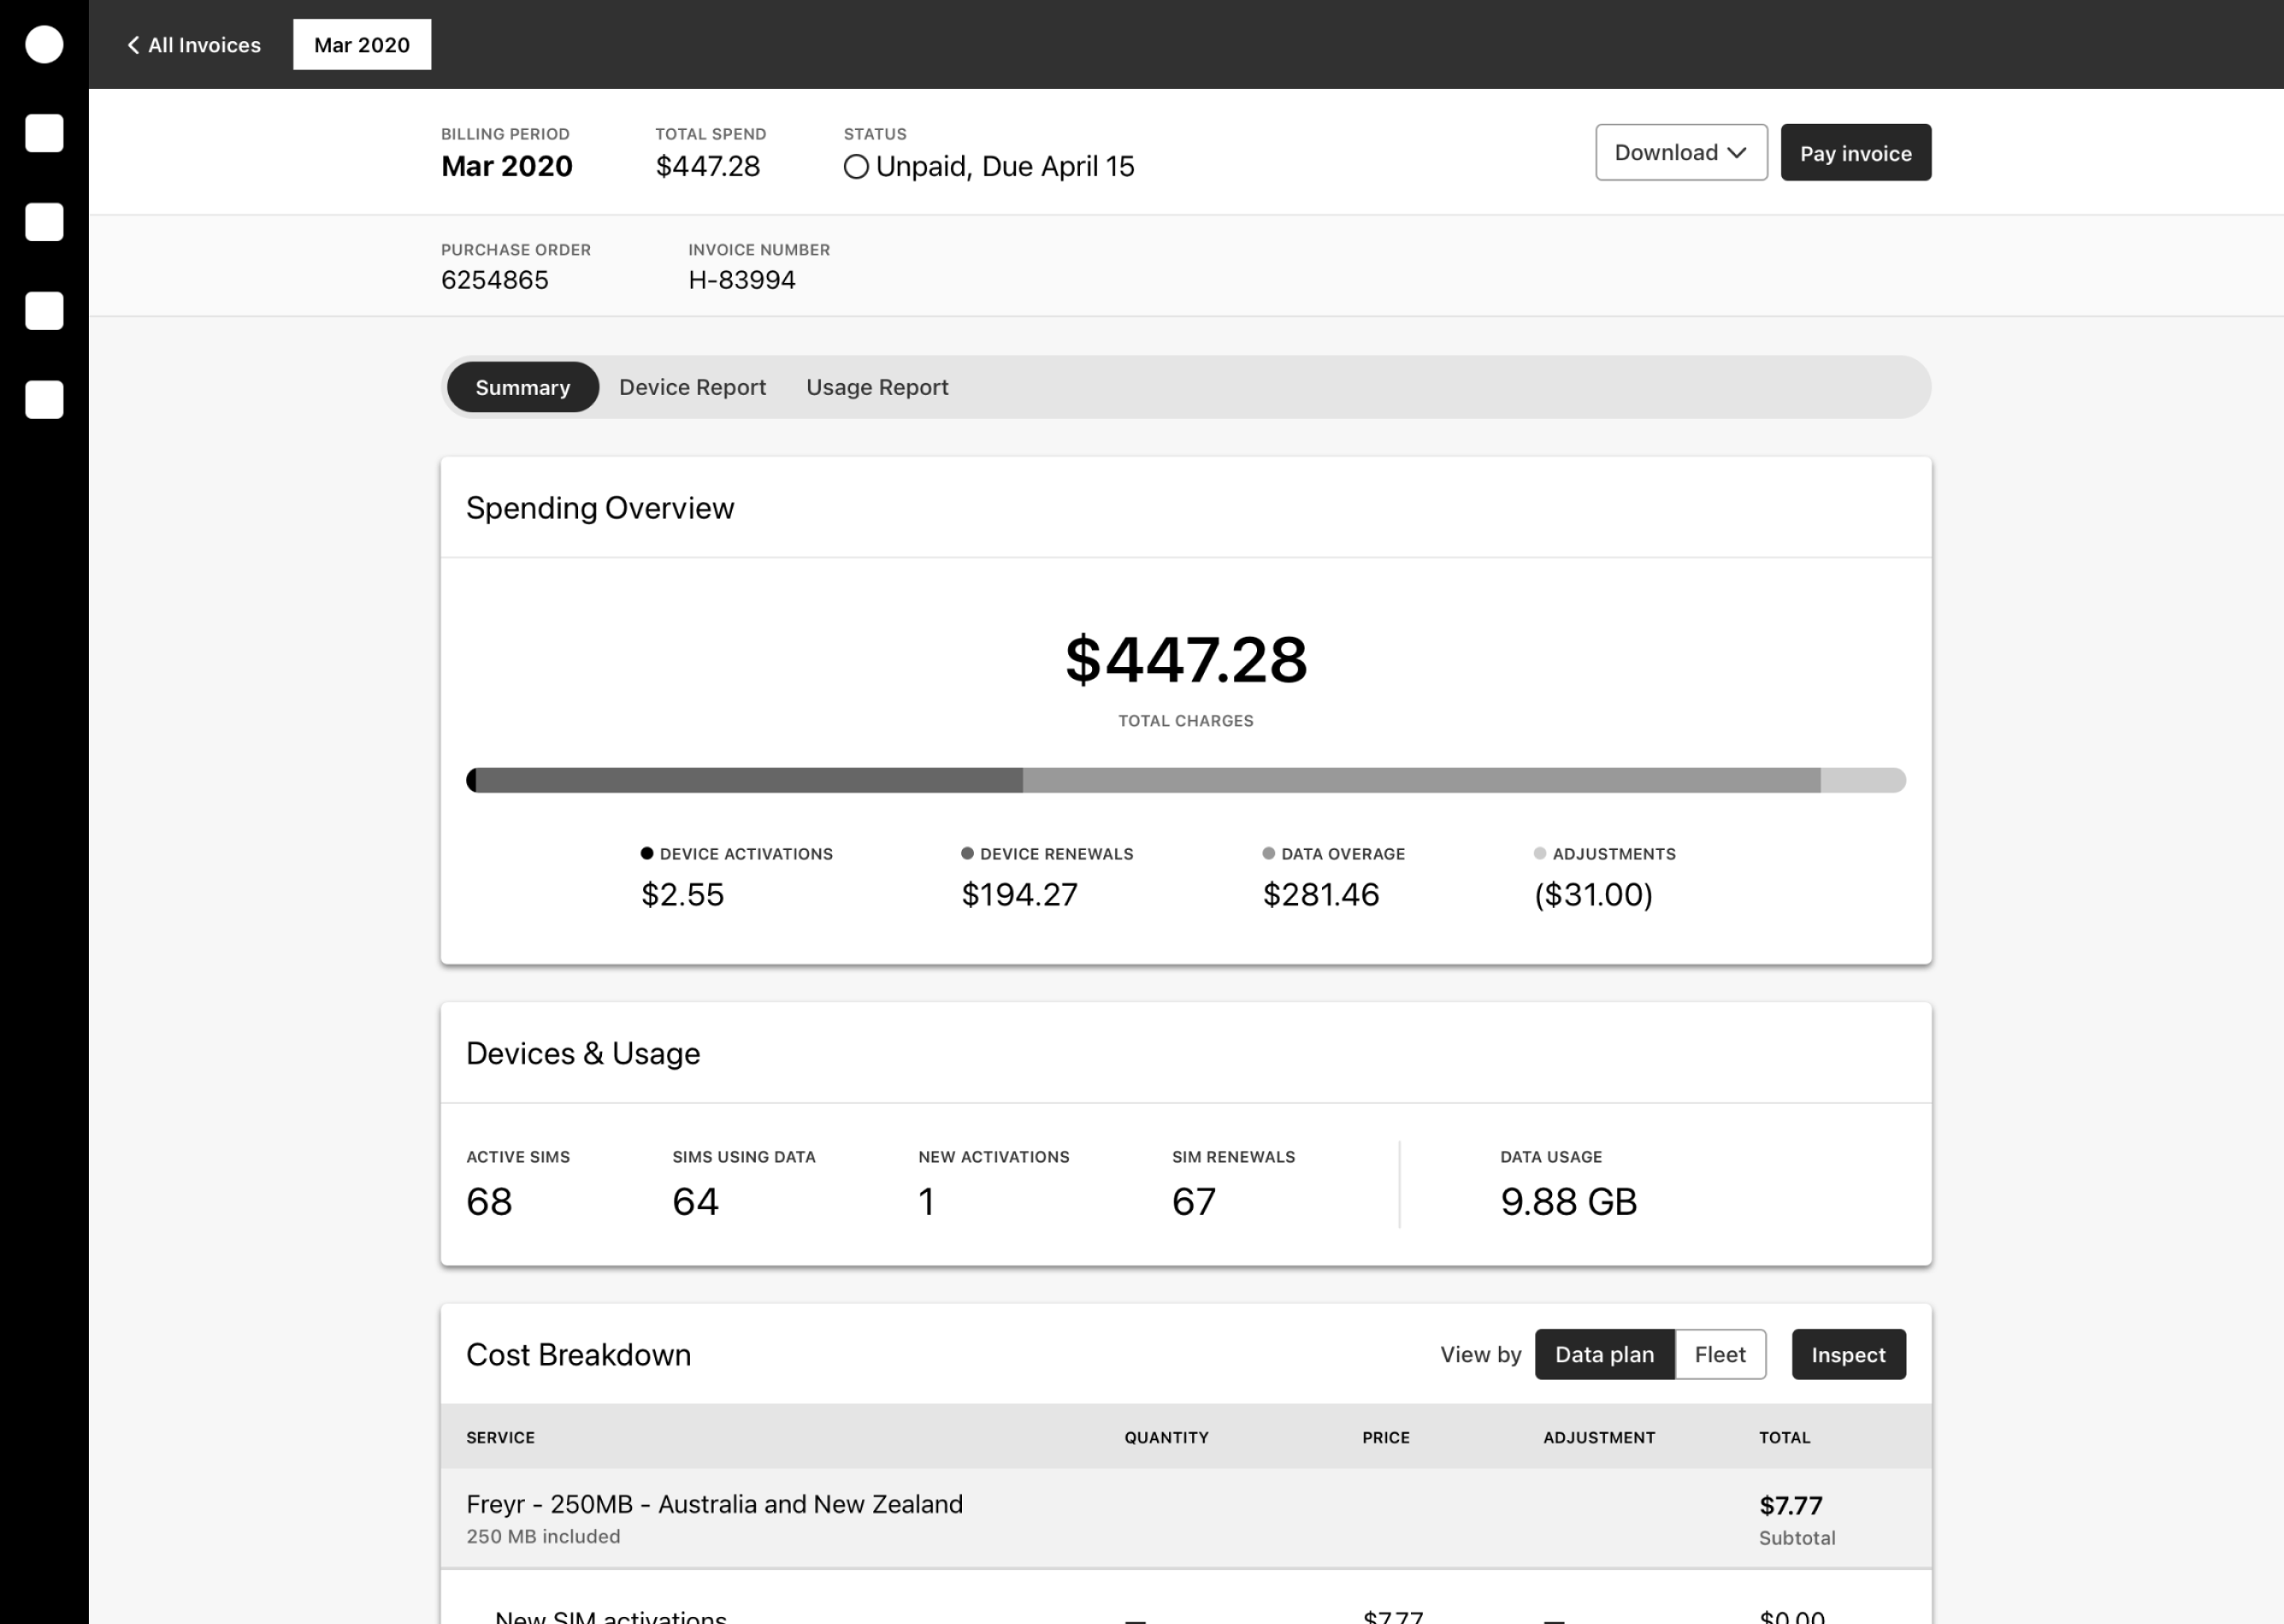
Invoice details and summary
-
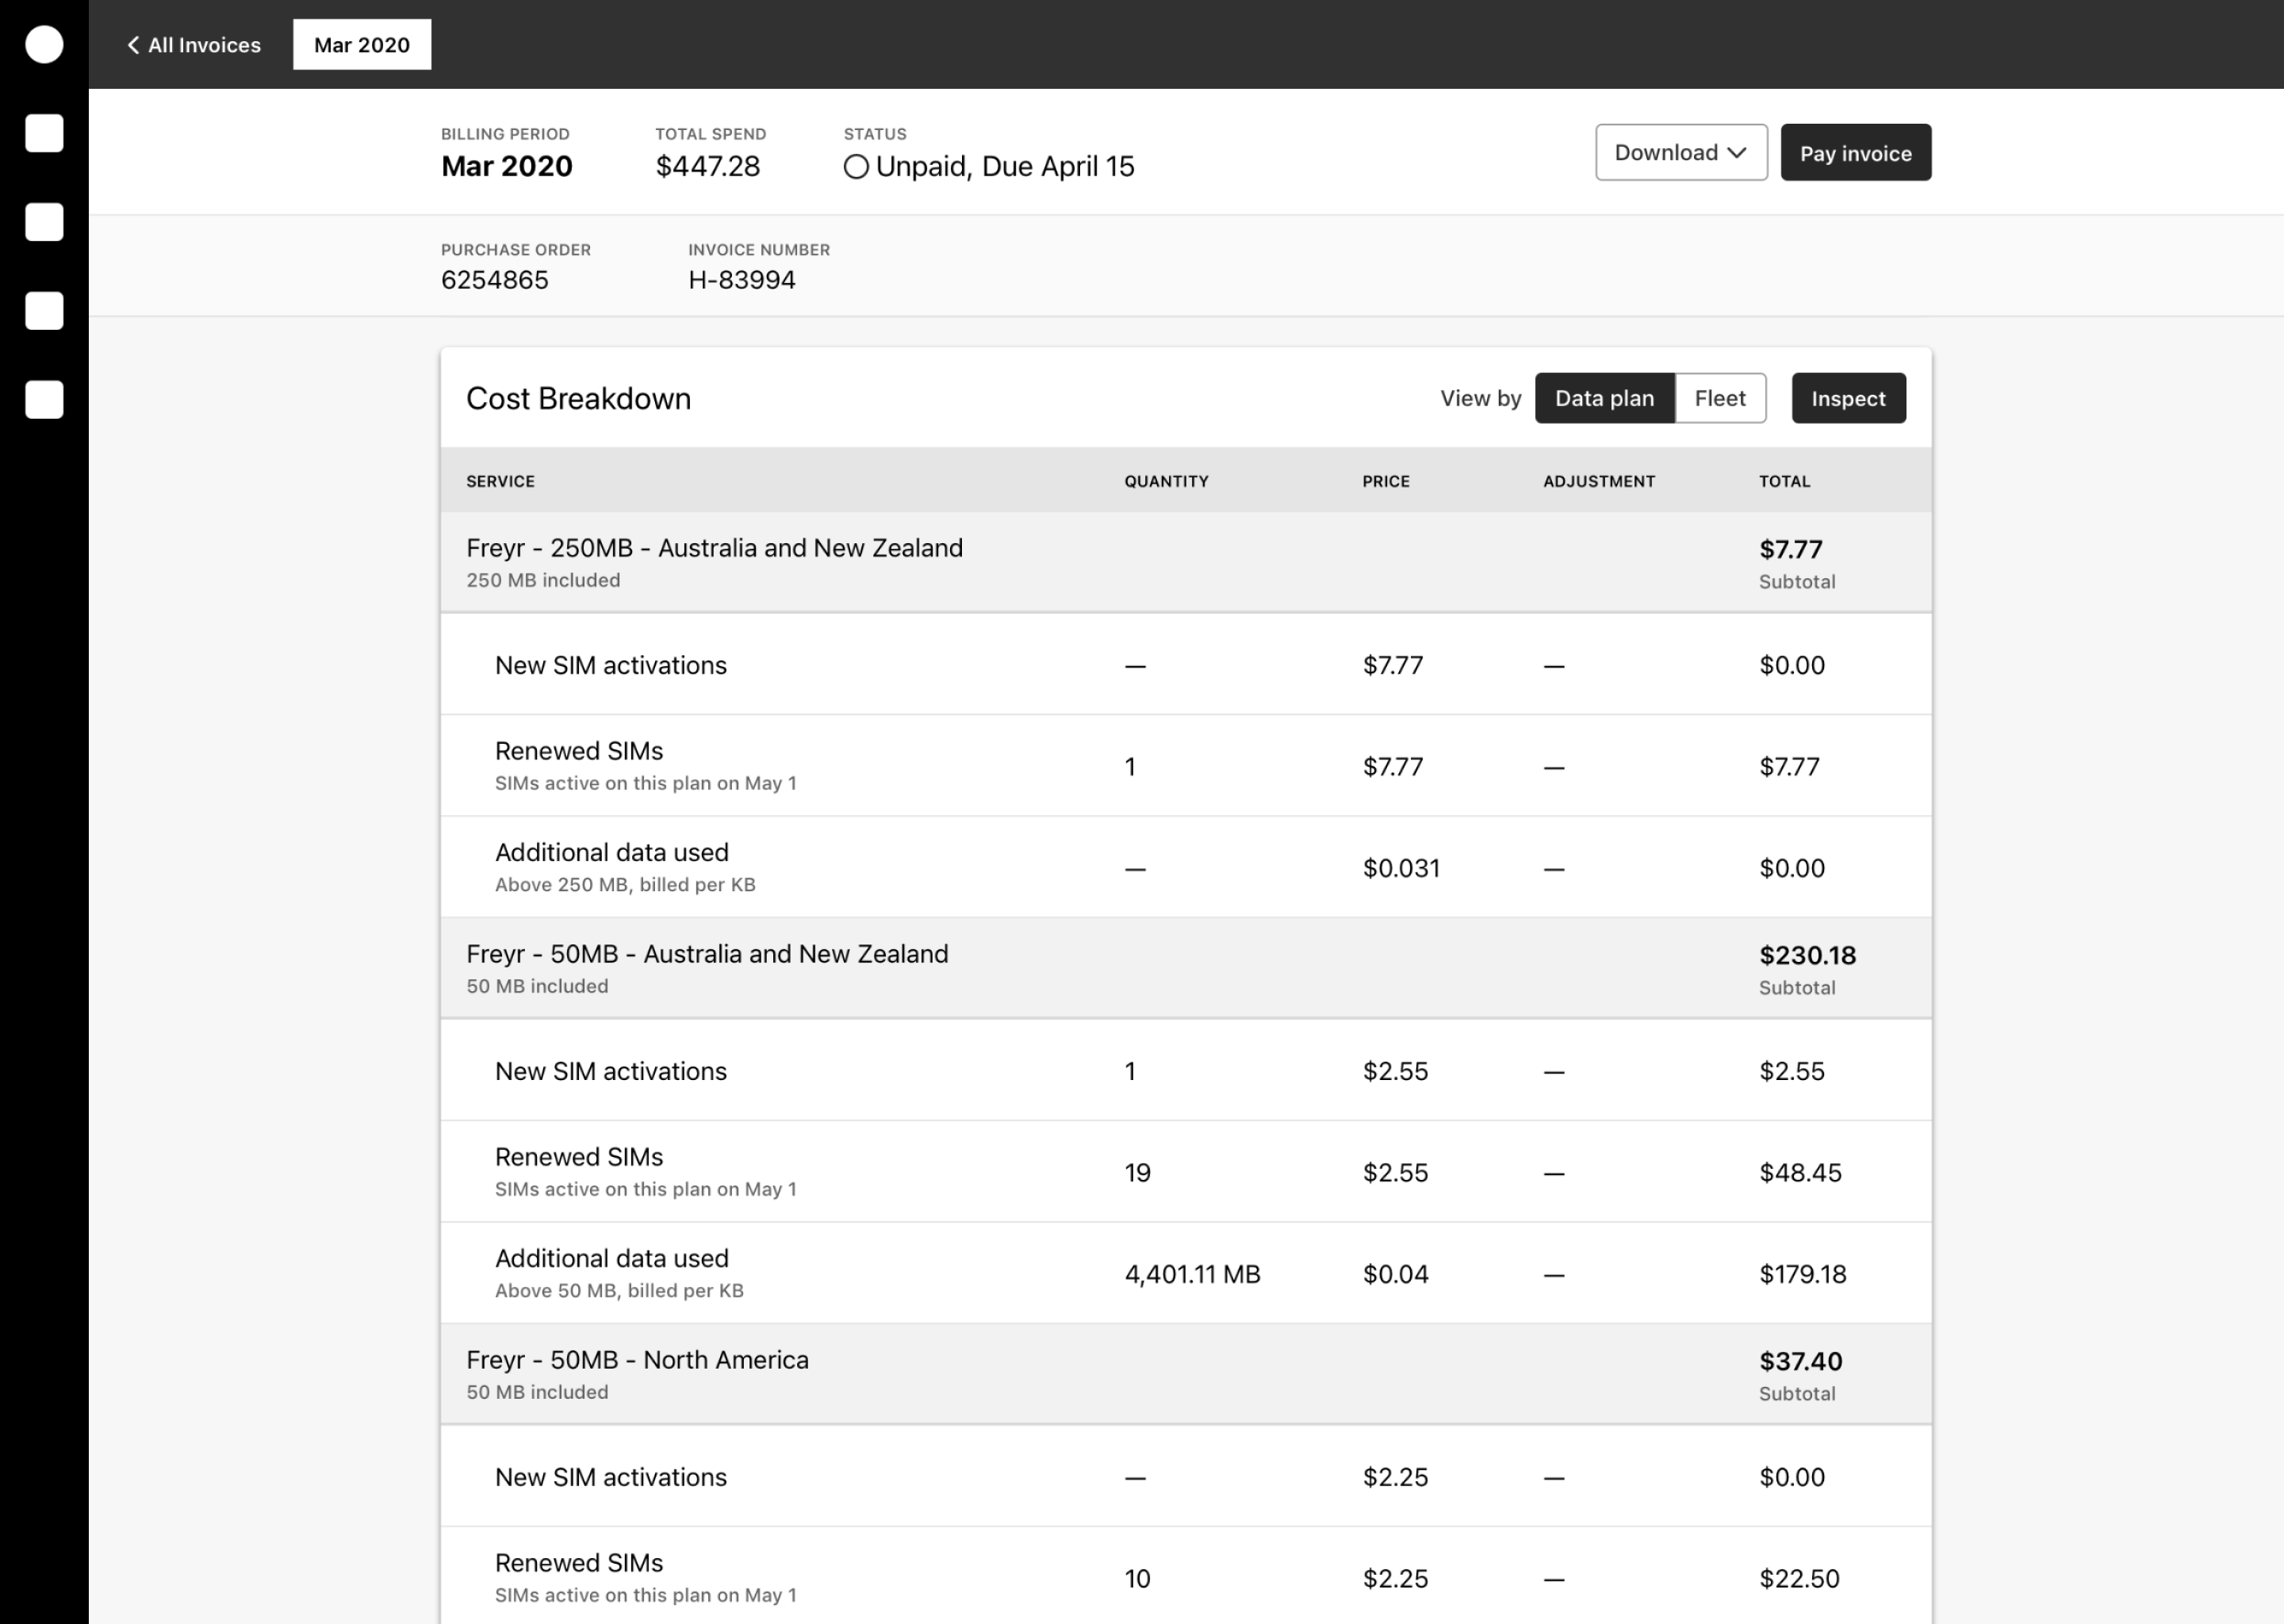
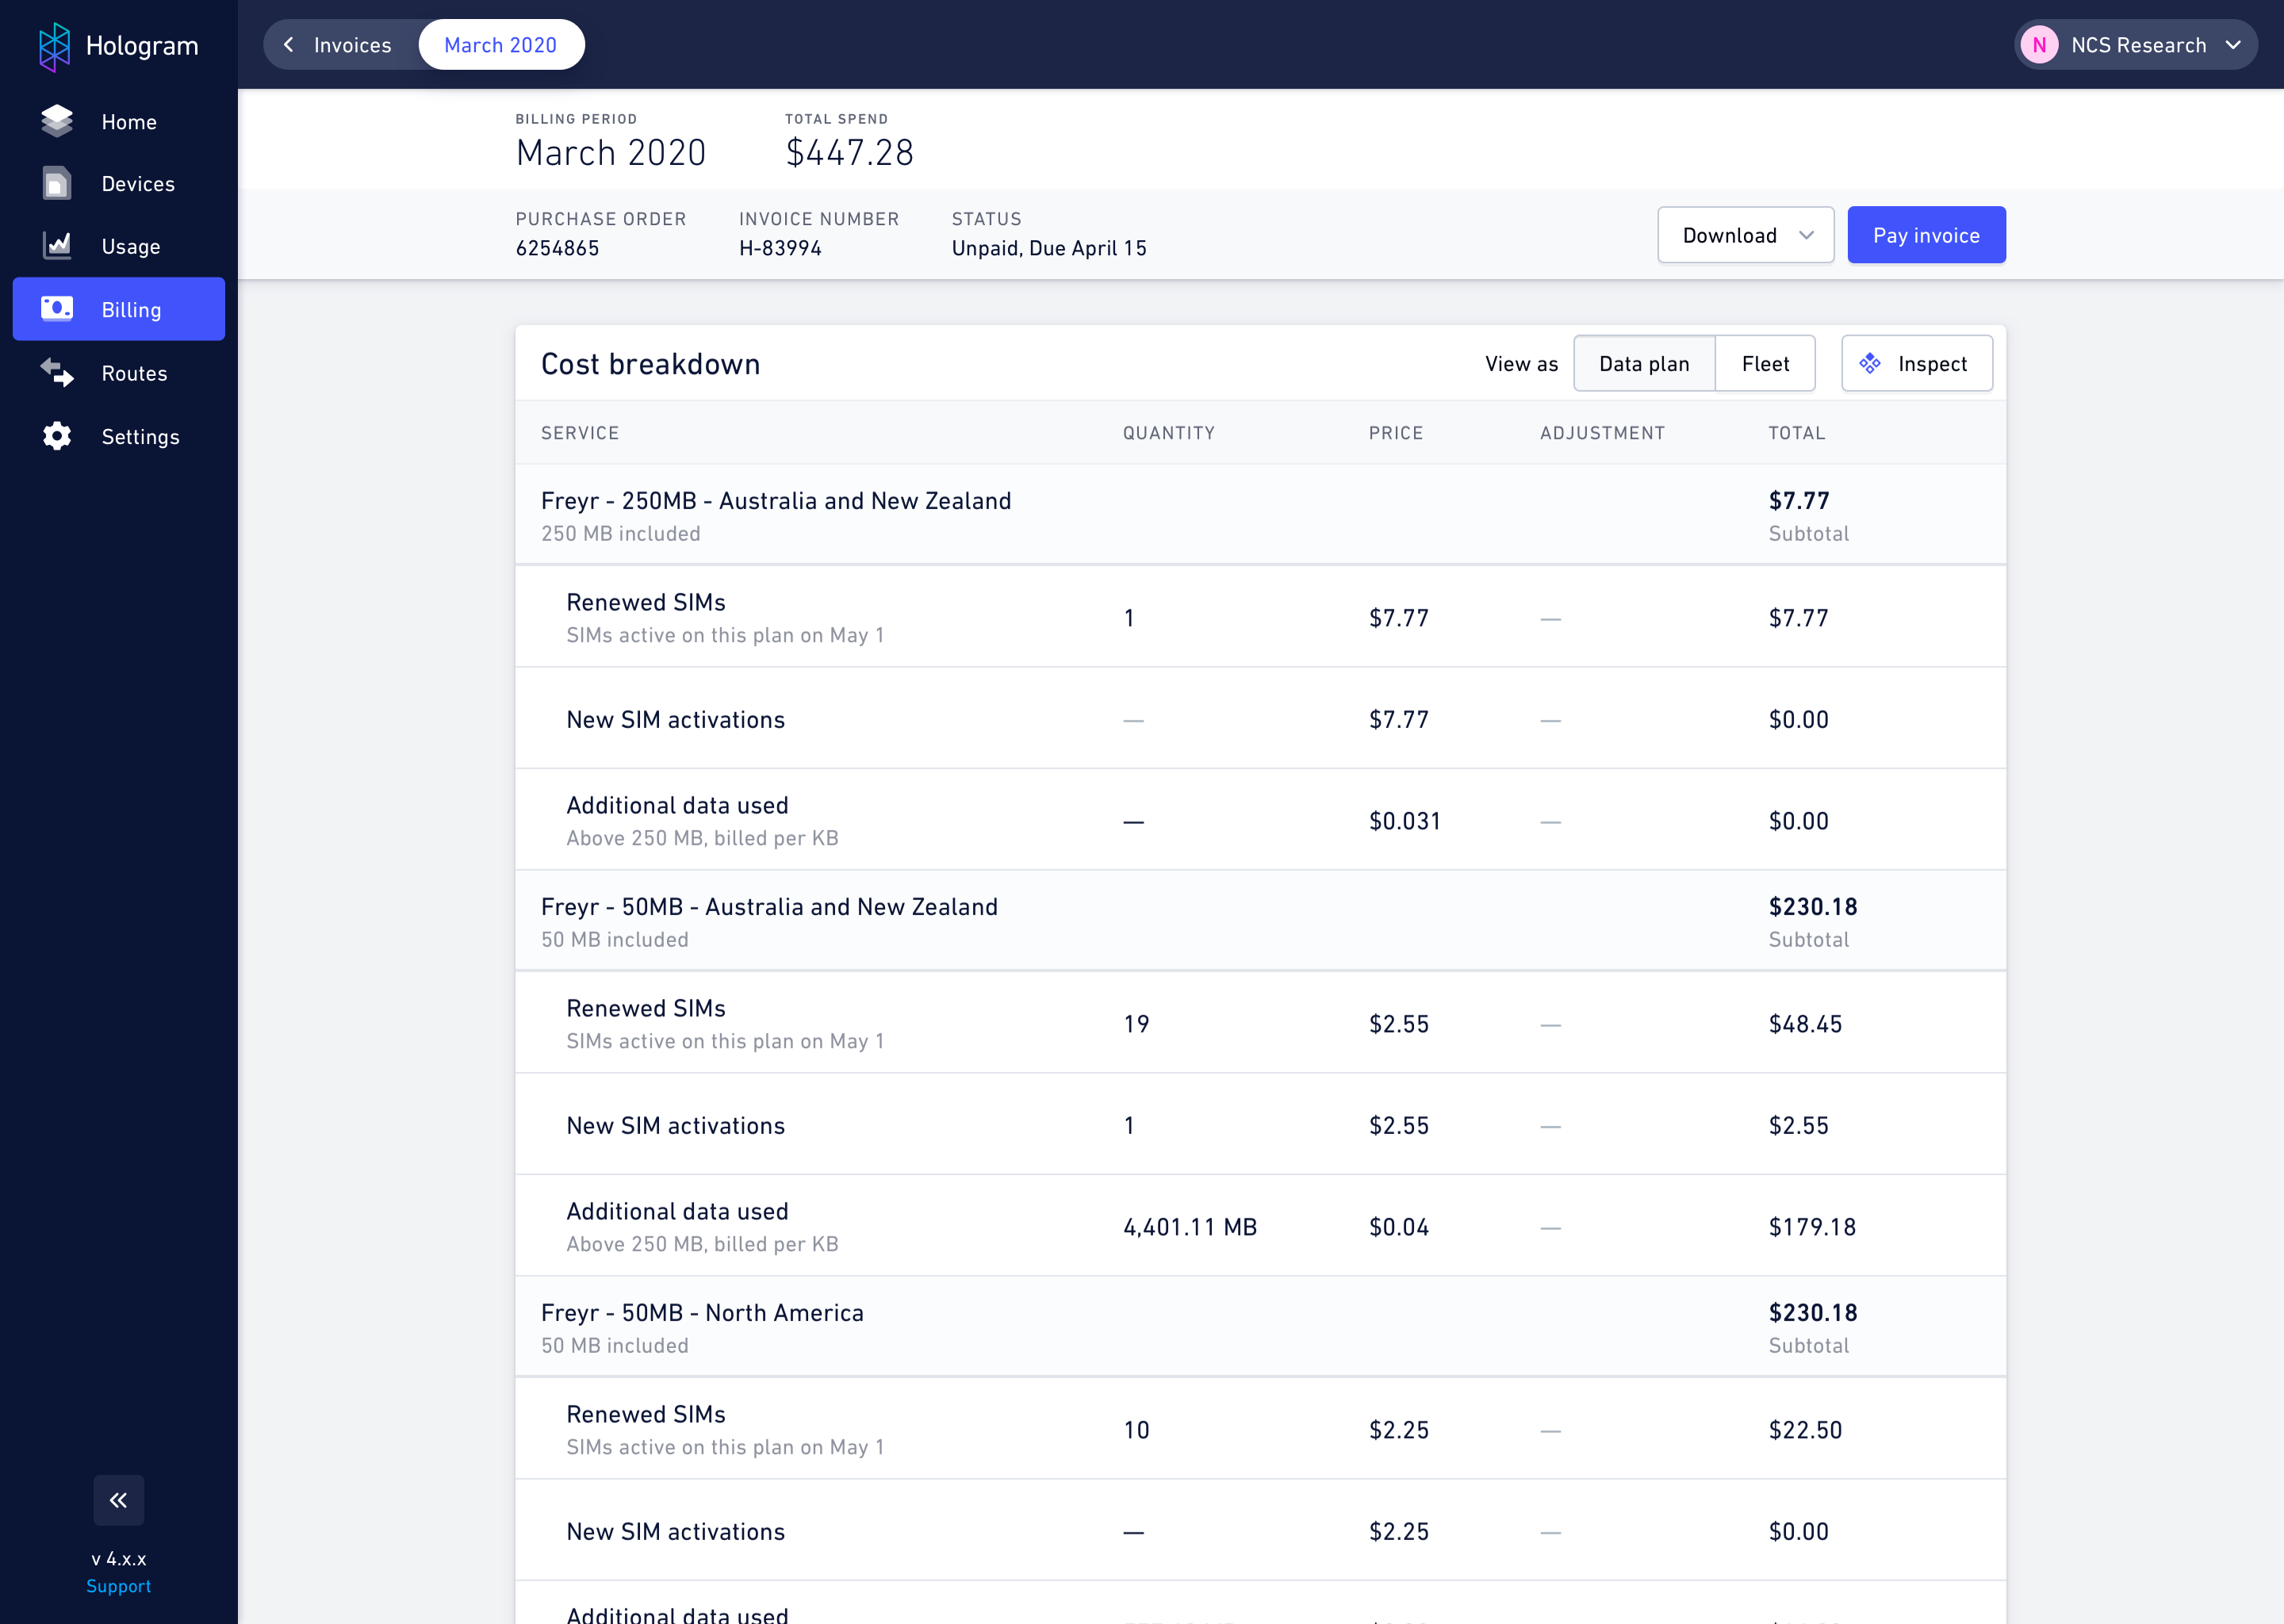
Cost breakdown
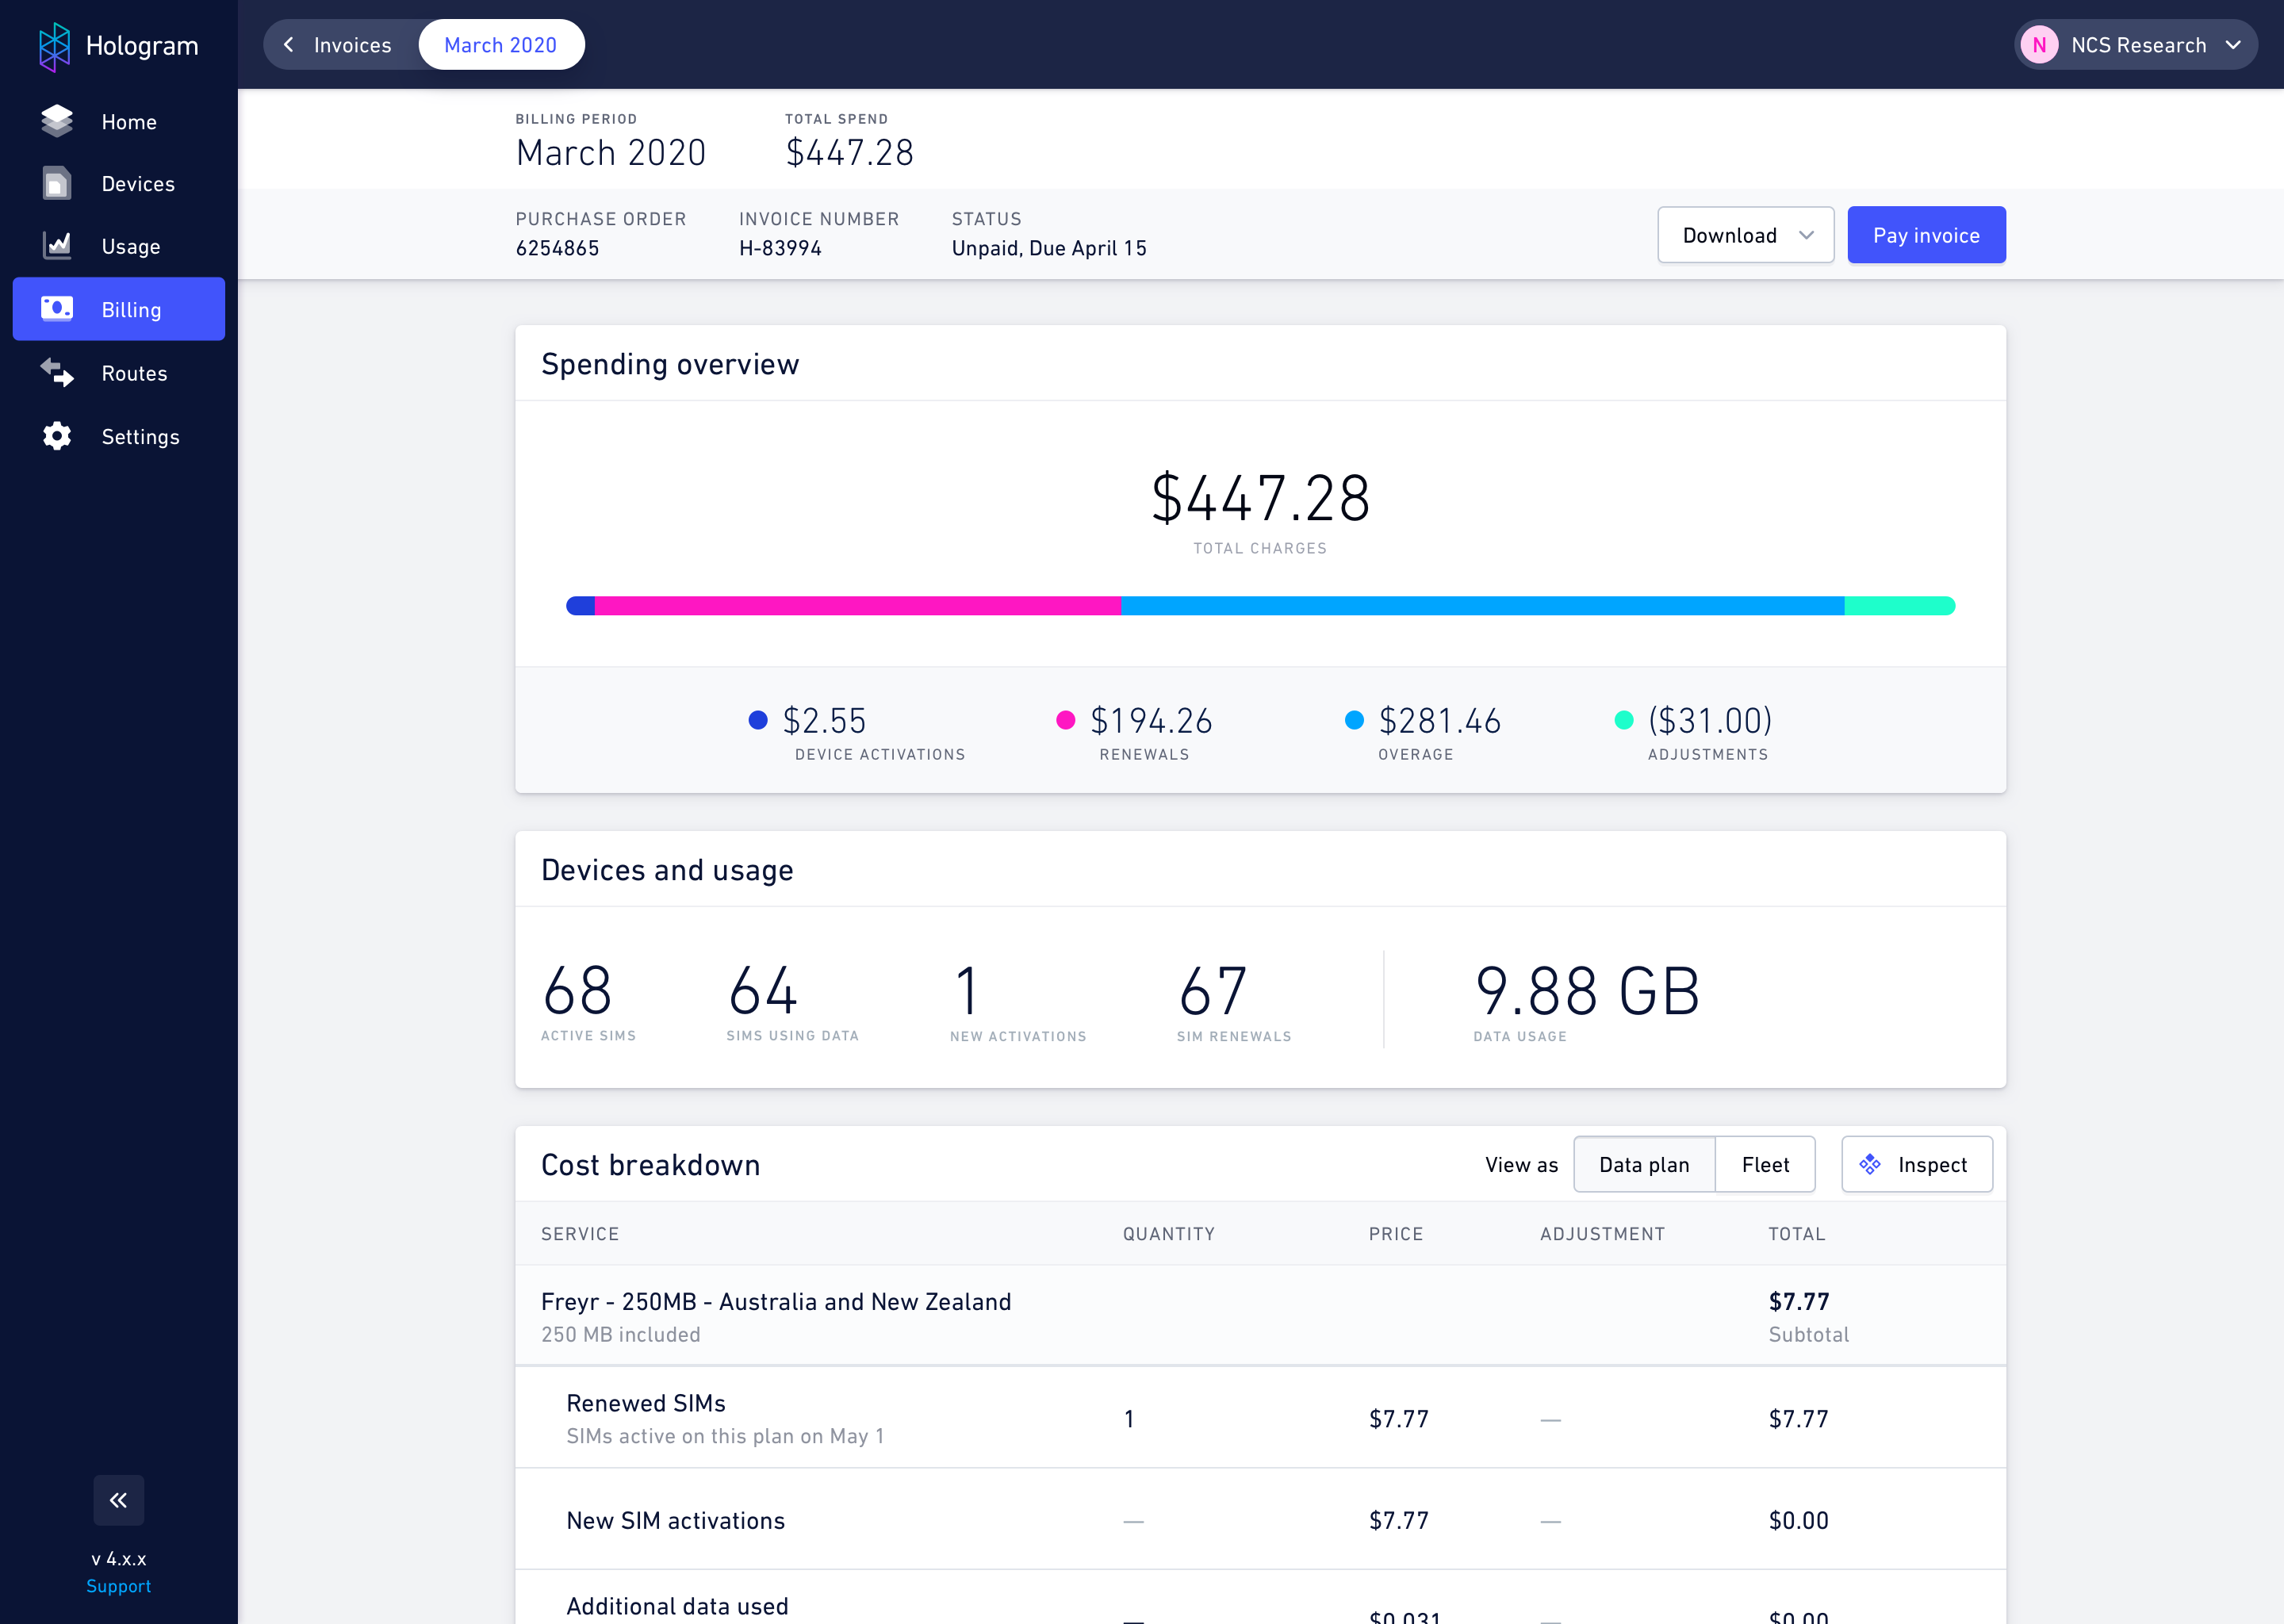
Wireframing
One of the themes I introduced to project was "opting into complexity." For some users, a simple display of what you owe is enough, and any more would be overwhelming and distracting. For larger orgs who require more investigation, you can "opt into" that additional detail.
Clicking into an invoice reveals a summarized spending overview for that pay period, and getting a full cost breakdown with the ability to pivot on Data Plan or Devices is a short scroll away.
-
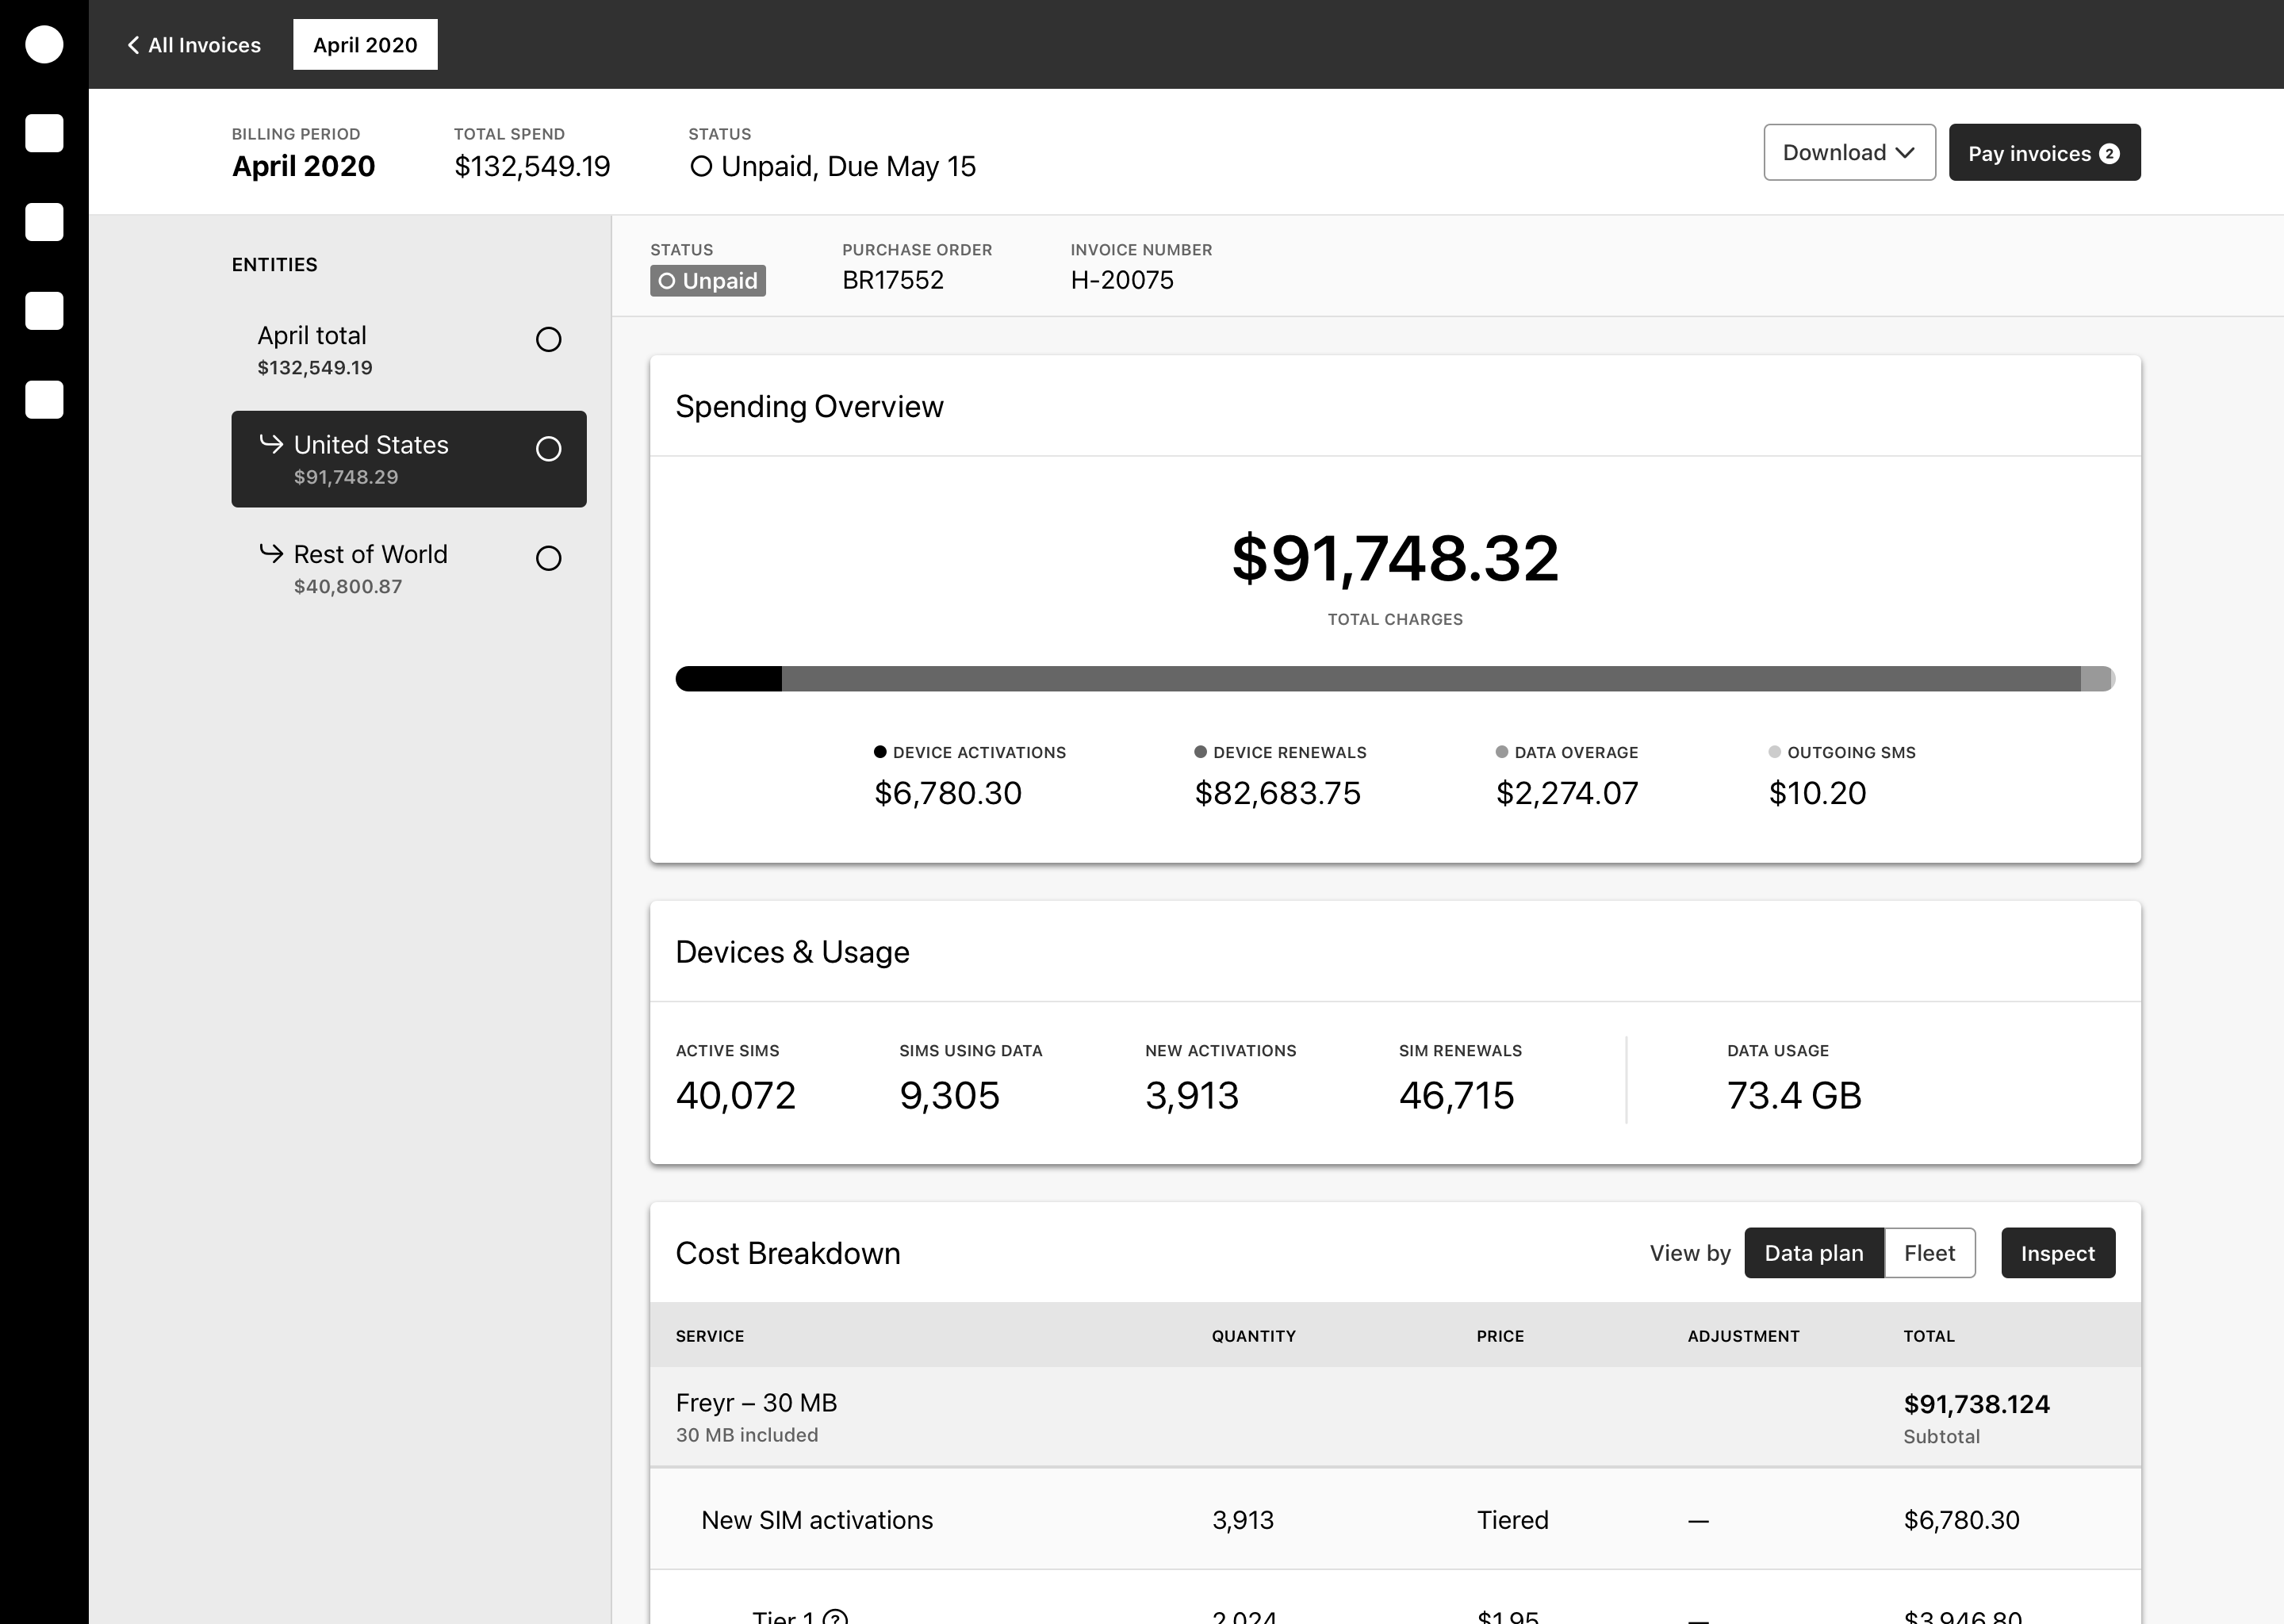
Organization with multiple business entities
-
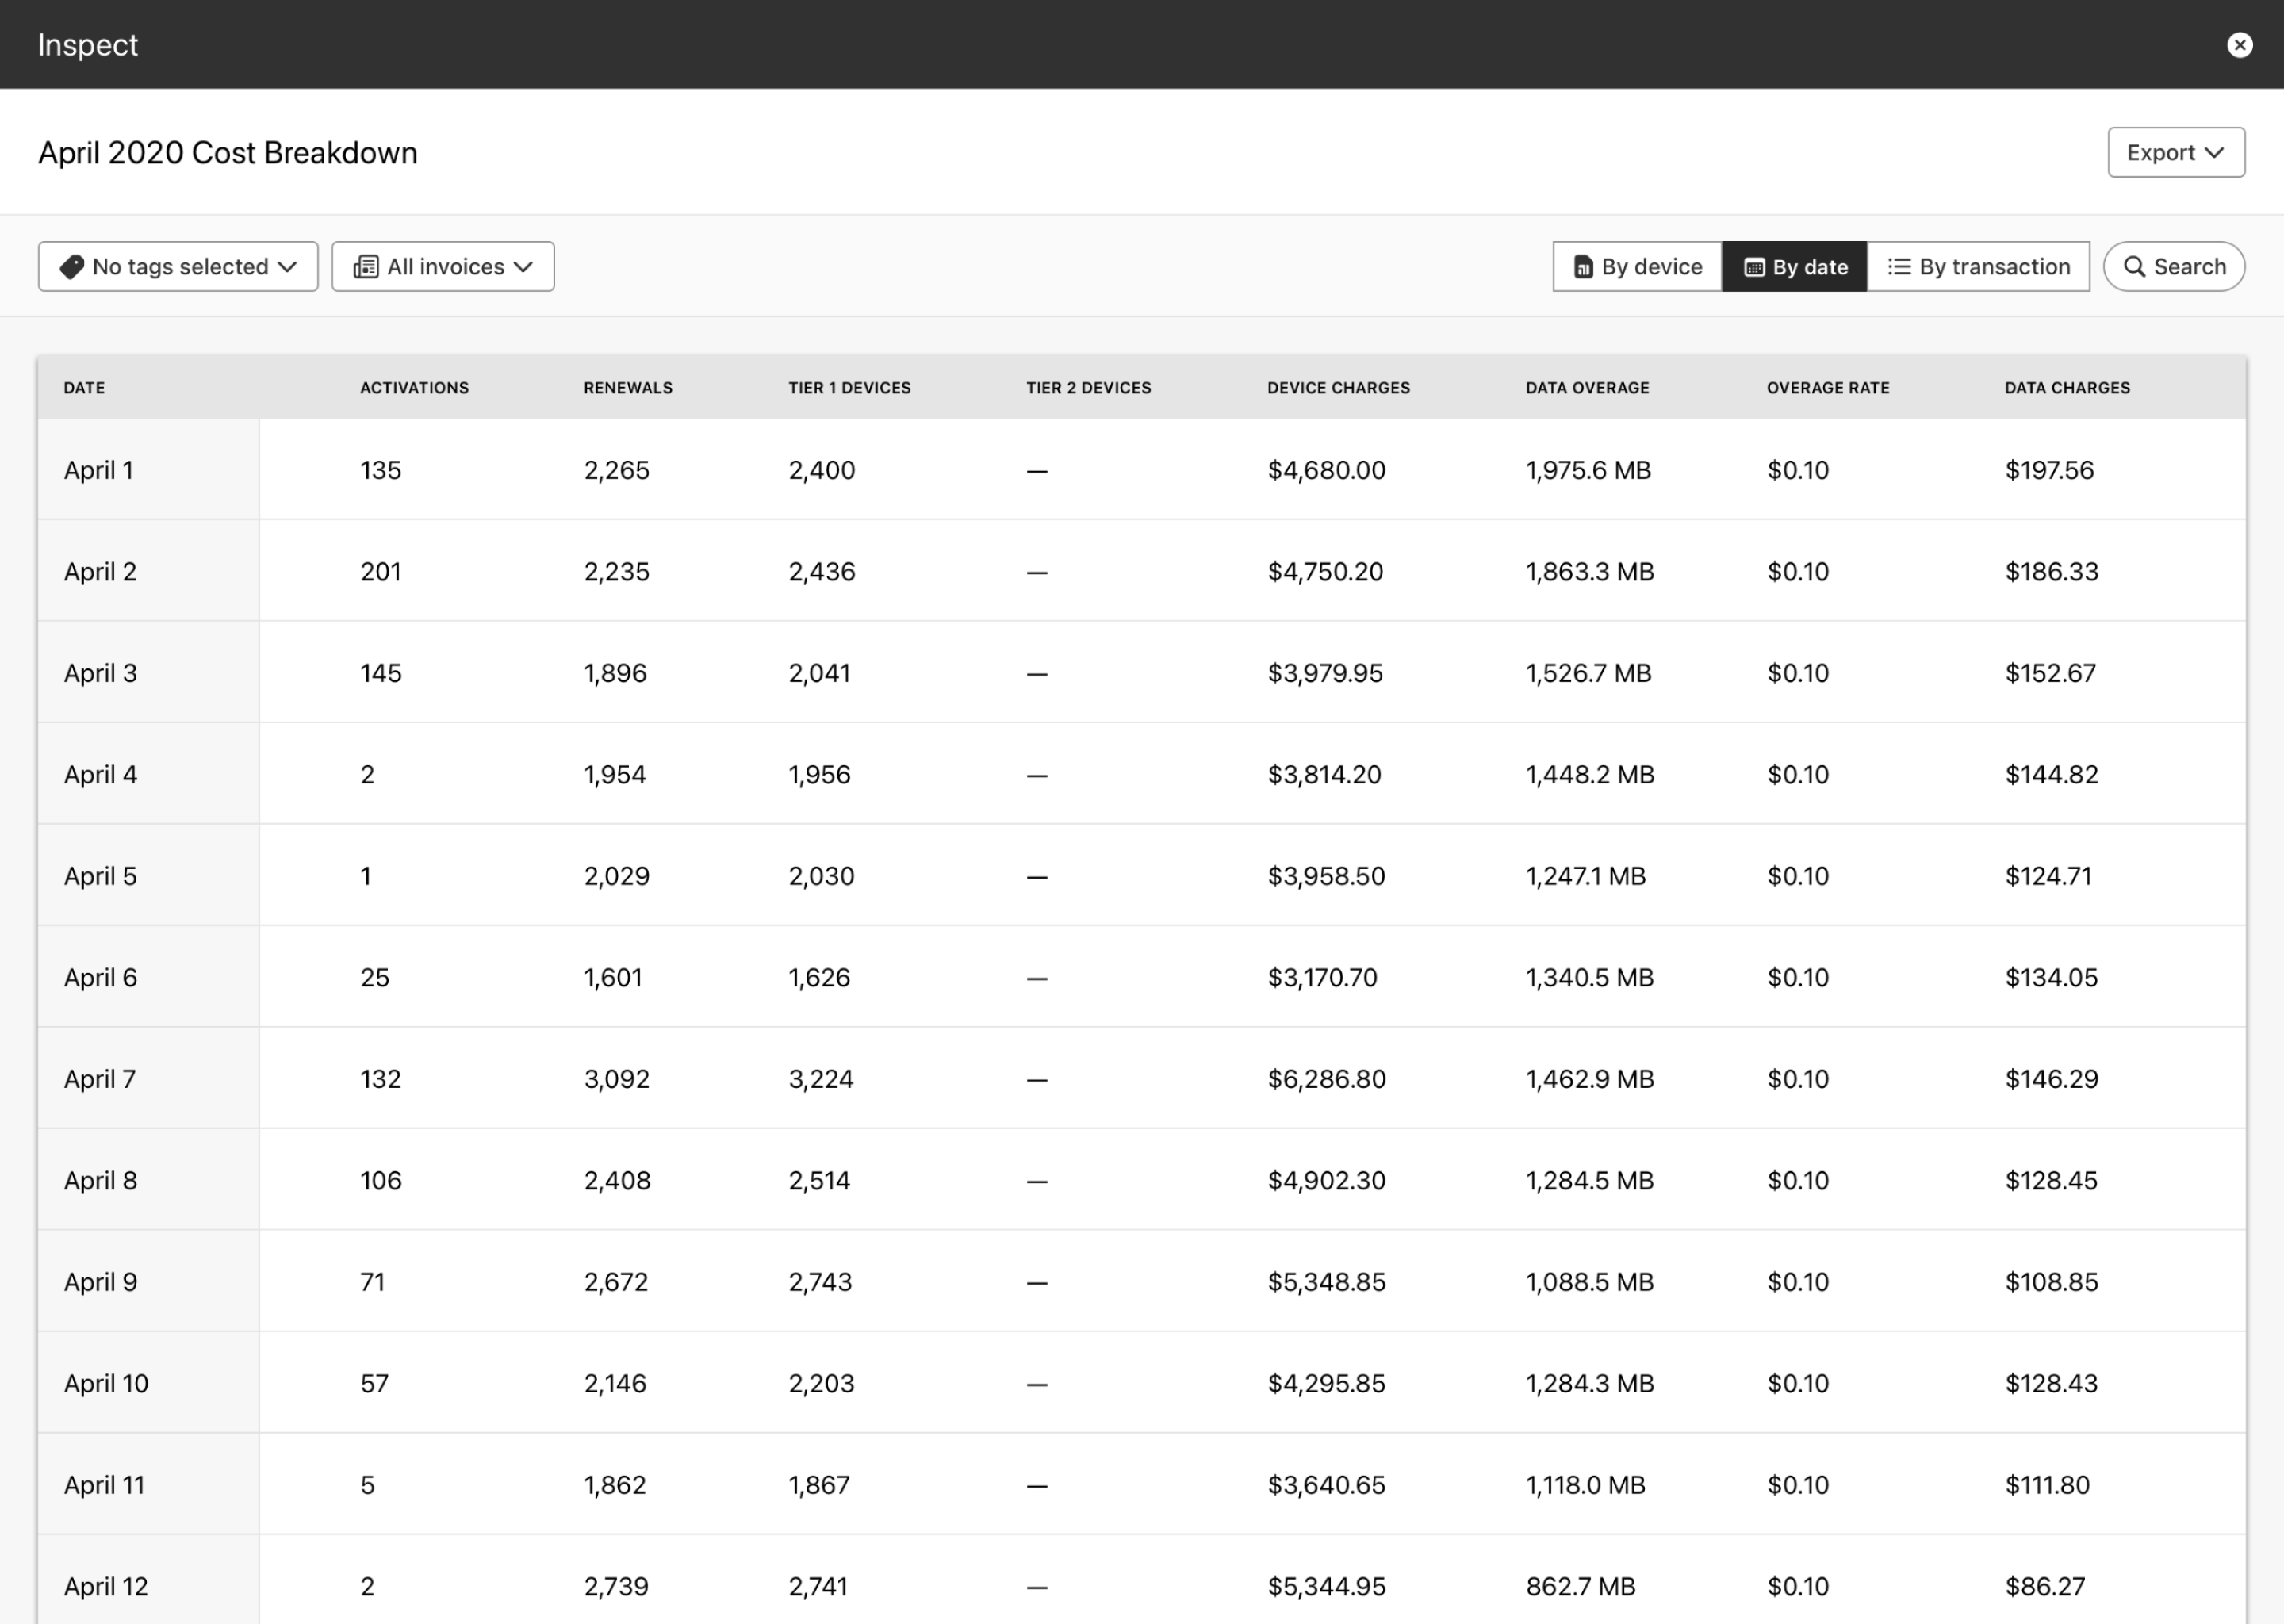
Cost breakdown by date, device, or transaction
-
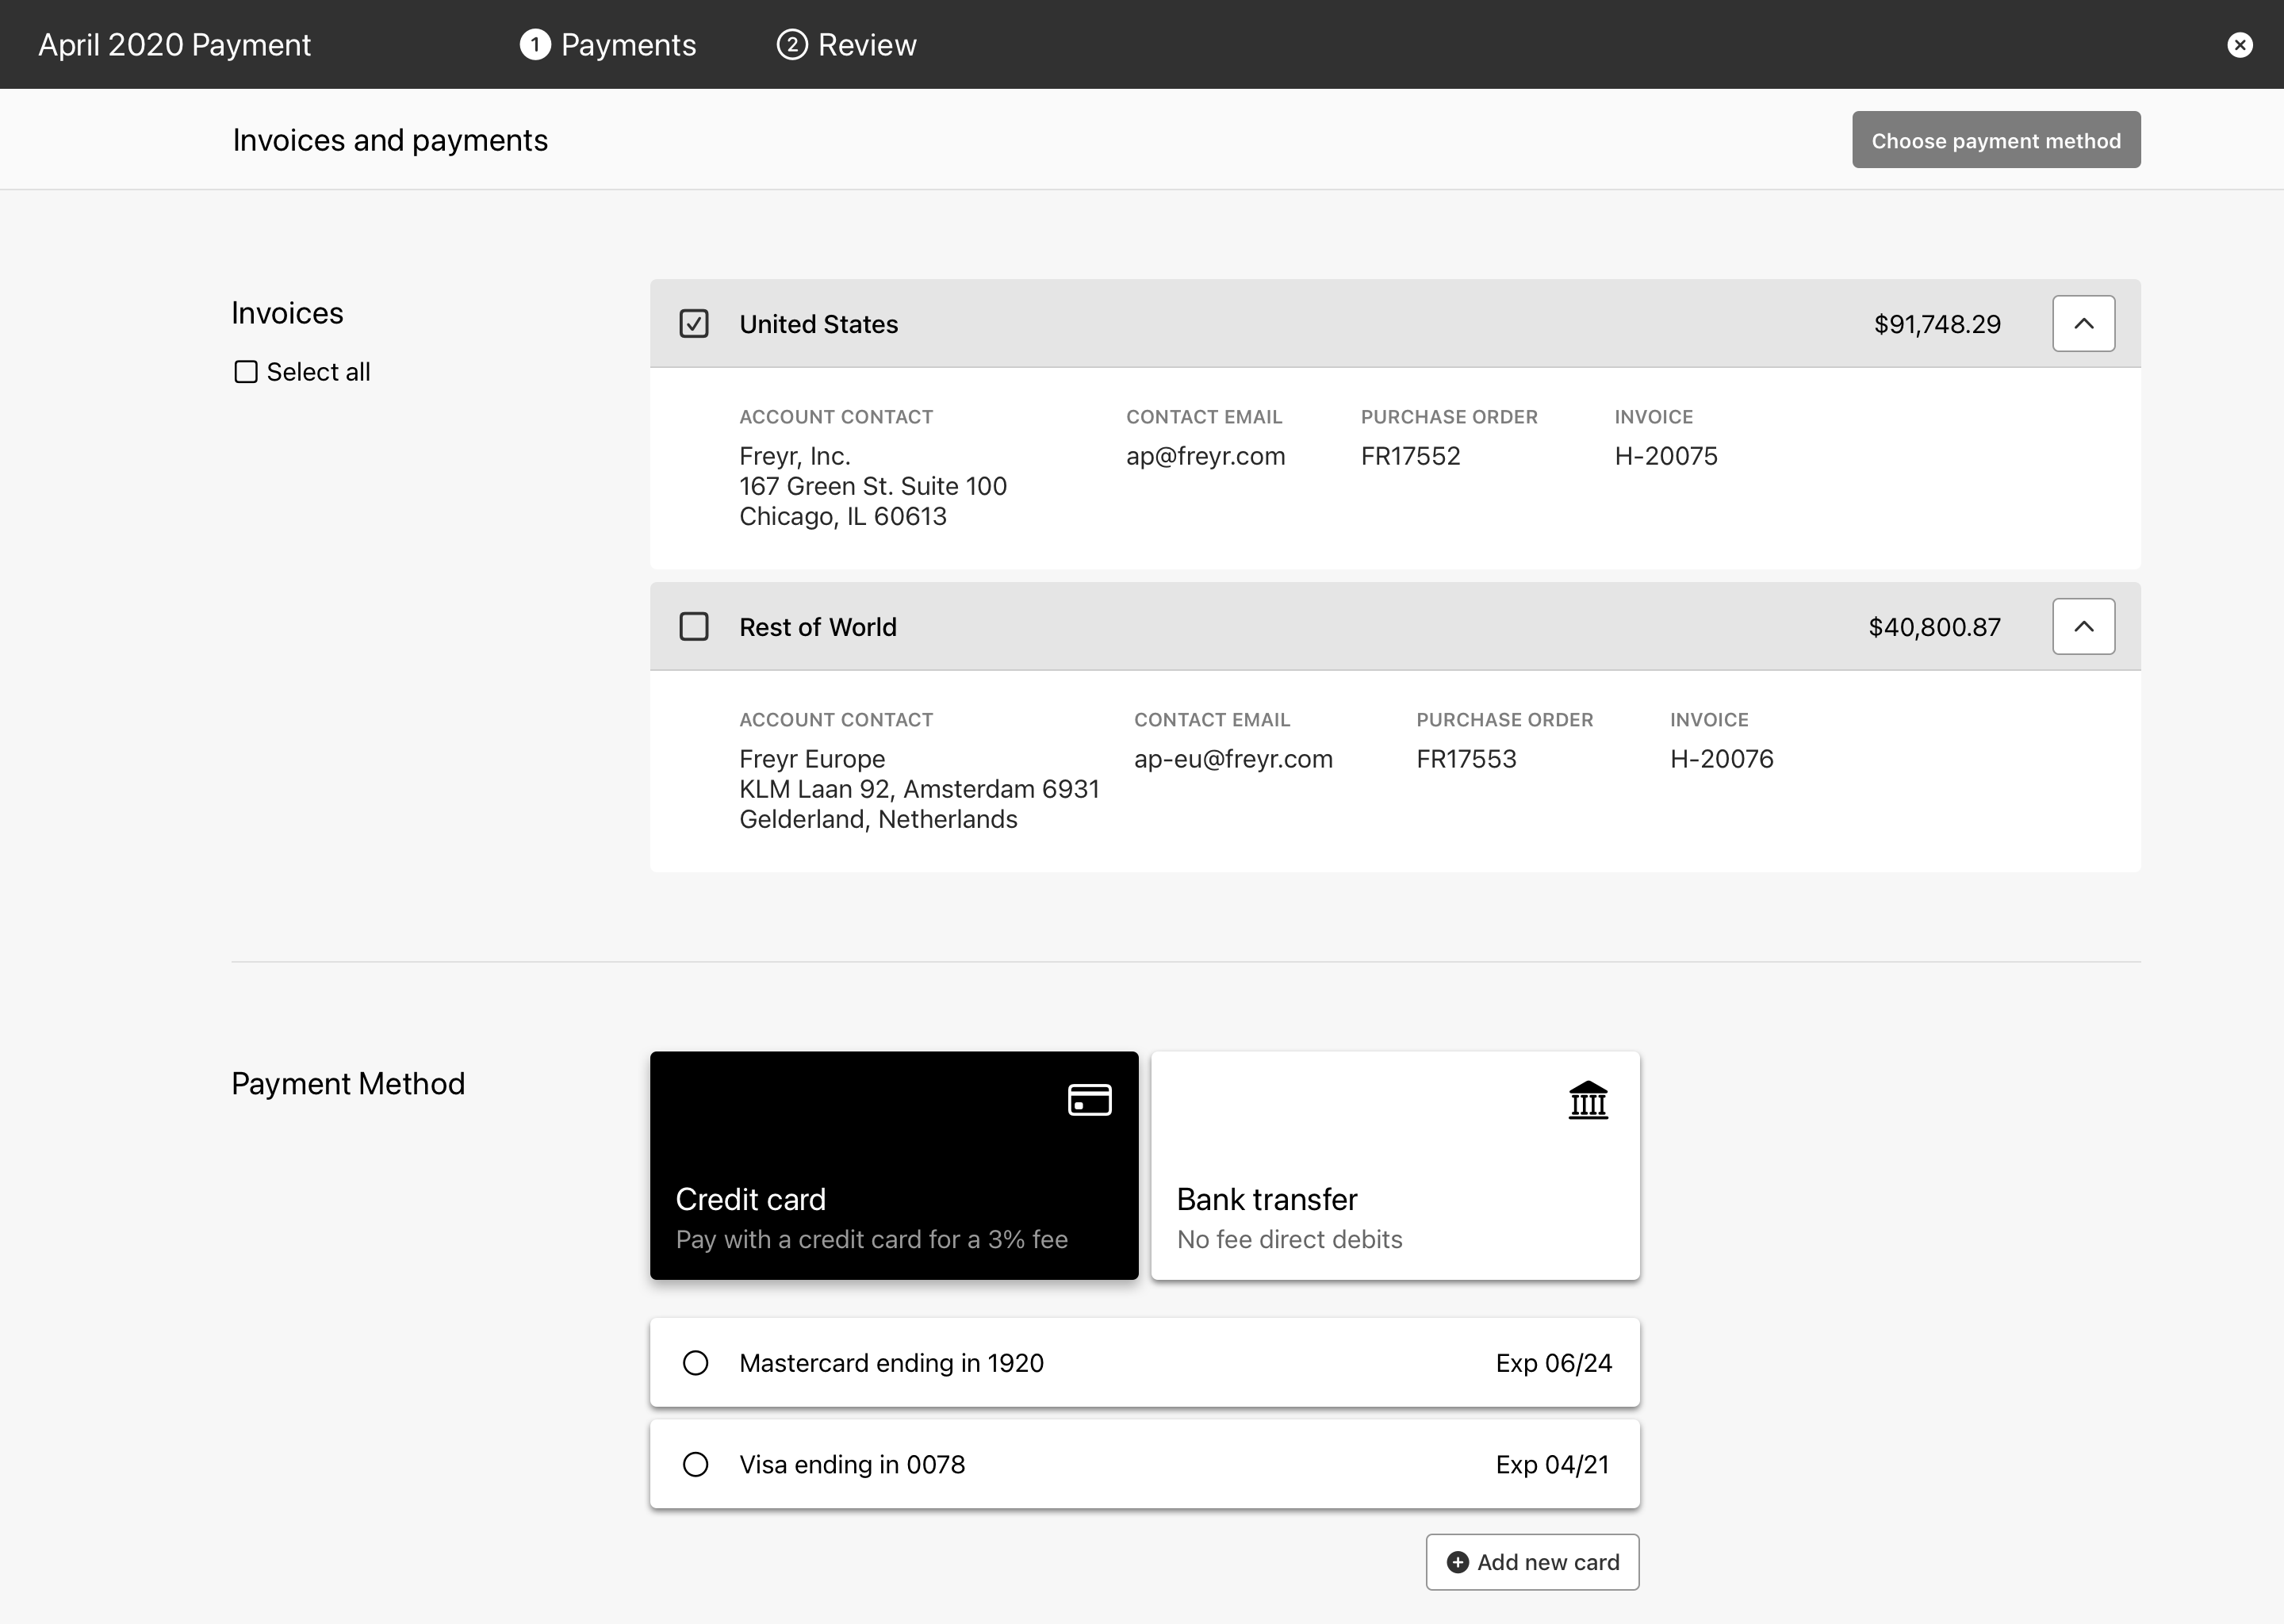
Pay invoice right from the Hologram Dashboard
Supporting global organizations
We met with organizations who operate with multiple global business entities, meaning their invoices might be paid out from banks in a number of countries. It was important that they had visiblity into each entity separately, as well as a global rollup for a richer understanding.
Additionally, we tested user flows for paying invoices right from the Hologram Dashboard. Before, customers were required to pay their invoice from a Stripe-branded landing page, which may cause confusion and erode trust in our brand.
-
All invoices
-
Invoice details and summary
-
Cost summary
High fidelity designs
Our research provided a clear sense of user need and reinforced many of our design intentions. I translated our wireframe concepts into high-fidelity prototypes for a final round of design validation ahead of engineering.